Since building a new computer, my Windows 10 installation would sometimes crash. The error reported on the blue screen of death would always be page fault in nonpaged area. Interestingly, the system would be fine for months and then suddenly crash a few times per day — always when using Deluge, a torrent client. After some testing, it turned out that downloading a torrent with Deluge would reliably crash the system within an hour.
Hibernation and Hybrid Sleep on Ubuntu 17.04, Gnome 3.24
I was having trouble using suspend, hibernate and hybrid sleep functionality on Ubuntu 17.04 using Gnome 3.24. The troubles started immediately after installing the uswsusp package:
$ apt-get install uswsusp
I was hopeful and typed systemctl hibernate, but the system got stuck on
“Snapshotting system”.
mIRC Smart Join/Part Filtering
Though internet relay chat (IRC) is old technology, many people still use it daily. One of the most popular IRC clients for Windows is mIRC. This client is impressively feature-complete. However, it does not offer a way to satisfyingly solve one of the grievances of many IRC users: the flood of join and part messages in big channels, caused by the constant stream of people coming in and leaving. mIRC only offers the option to either show or hide all join and part messages completely; but does not allow for any fine-tuning.
Inductively Defined Lists and Proofs
In this post, we will explore an inductive data structure as a type for lists of elements. We define two recursive functions that can be applied to lists of this type; namely, an operation to append two lists and an operation to reverse a list. With these definitions, we set out to mathematically prove a number of properties that should hold for these functions by means of induction.
A list is a data structure of a collection of elements in a certain order. A list can be defined in multiple ways. One way is to define a list as being an element (the “head” of the list) followed by another list (the “tail” of the list). Inductively, this could be formalized as follows:
Illogical Reasoning and Reasonable Illogicality: The Differences Between Logic and Reason
What is reasonable is not necessarily logical. One can believe two things and realize that they imply a third thing. Instead of coming to believe the third thing, that person might find they should stop believing one of the first two if they have a good reason to believe the third is false. Similarly, a person with those beliefs, except without a good reason to believe the third is false, might still not infer that the third is true: they might be utterly uninterested in whether it is true or not. There are many things one believes, and though it would be logical to follow those beliefs to their logical conclusions, this would result in one’s mind being filled with trivialities; a consequence that makes the action unreasonable.
An Introduction to Turing Machines
A Turing machine is a mathematical model of a mechanical machine. At its roots, the Turing machine uses a read/write head to manipulate symbols on a tape. It was invented by the computer scientist Alan Turing in 1936. Interestingly, according to the Church-Turing thesis this simple machine can do everything any other computer can do; including our contemporary computers. Though these machines are not a practical or efficient means to calculate something in the real world, they can be used to reason about computability and other properties of computer programs.

Alan Turing
Alan Turing Quote from Computing Machinery and Intelligence
The view that machines cannot give rise to surprises is due, I believe, to a fallacy to which philosophers and mathematicians are particularly subject. This is the assumption that as soon as a fact is presented to a mind all consequences of that fact spring into the mind simultaneously with it. It is a very useful assumption under many circumstances, but one too easily forgets that it is false.
– Alan Turing, 1950
Why You Should Never Go Data Fishing
Most likely you will have heard that you should never go data fishing, meaning that you should not repeatedly test data. In the case of statistical significance tests, perhaps you will have heard that because of the nature of these tests you will find an effect at the 5% significance level in 5% of cases when there actually is no effect, and an effect at the 2% significance level in 2% of cases when there actually is no effect, and so on. It is less likely you will have heard not to continue looking for an effect after your current test concluded there was none. Here is why.
Plotting a Heat Map Table in MATLAB
A little while ago I found myself needing to plot a heat map table in MATLAB. Such a plot is a table where the cells have background colors; the colors depend on the value in the cell, e.g. a higher value could correspond with a warmer color. I found no existing function to do this easily, so I set out to create my own solution.
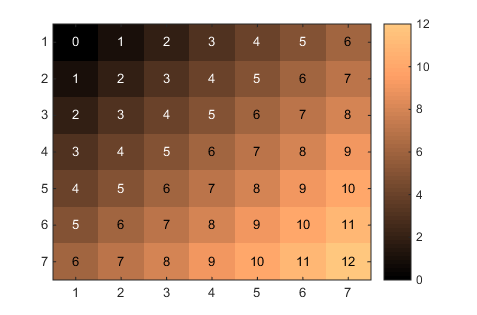
The code to plot a heat map table can be found here.
Training, Testing and Development / Validation Sets
Finding models that predict or explain relationships in data is a big focus in information science. Such models often have many parameters that can be tuned, and in practice we only have limited data to tune the parameters with. If we make measurements of a function f(x) at different values of x, we might find data like in Figure (a) below. If we now fit a polynomial curve to all known data points, we might find the model that is depicted in Figure (b). This model appears to explain the data perfectly: all data points are covered. However, such a model does not give any additional insight into the relationship between x and f(x). Indeed; if we make more measurements, we find the data in Figure (c). Now the model we found in (b) appears to not fit the data well at all. In fact, the function used to generate the data is f(x) = x + \epsilon with \epsilon Gaussian noise. The linear model f'(x) = x depicted in Figure (d) is the most suitable model to explain the found data and to make predictions of future data.